
Active Transformer Monitoring Services for Solar Power Utilities
Protect revenue, extend asset life, and meet rising compliance demands with continuous transformer intelligence.
Solar and storage portfolios are outpacing the transformers that connect them to the grid. For operators of 15–50 MVA step-up units under inverter-based generation, rapid ramps, harmonics, daily thermal cycling, and long lead times have rewritten the risk equation.
What's your own case study?
Use our Solar Utility Risk Calculator to quantify your own exposure. Enter a fleet profile and get a realistic risk picture.

The operational reality facing solar operators
Portfolio acquisitions compound the exposure.
How reliable is the condition history of inherited infrastructure? Without continuous baselines, asset managers cannot distinguish healthy units from those already on a degradation trajectory.
Changing fleet footprints.
Inverter-based generation subjects step-up transformers to electrical stressors that traditional time-based maintenance was never designed to catch.
Regulatory pressure is rising in parallel.
Key standards now push continuous monitoring. Most programs require condition-based maintenance for critical electrical assets and increasingly expect documented monitoring evidence.
ZTZ Services active transformer monitoring closes the gap
Enabling accurate, high-resolution data that solar-specific failure modes demand.
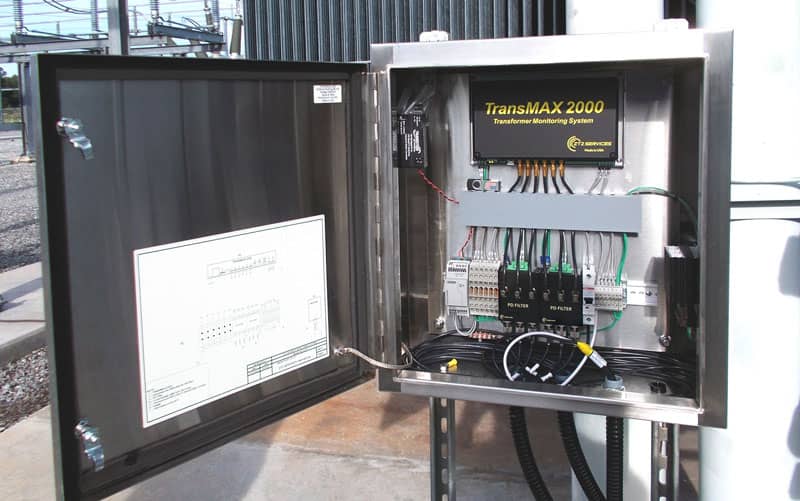
Bushing monitoring for solar farm applications
The SCADA compatible ZVCM-1001 simultaneously tracks relative capacitance, power factor, imbalance currents, and phase angles on up to six bushings.
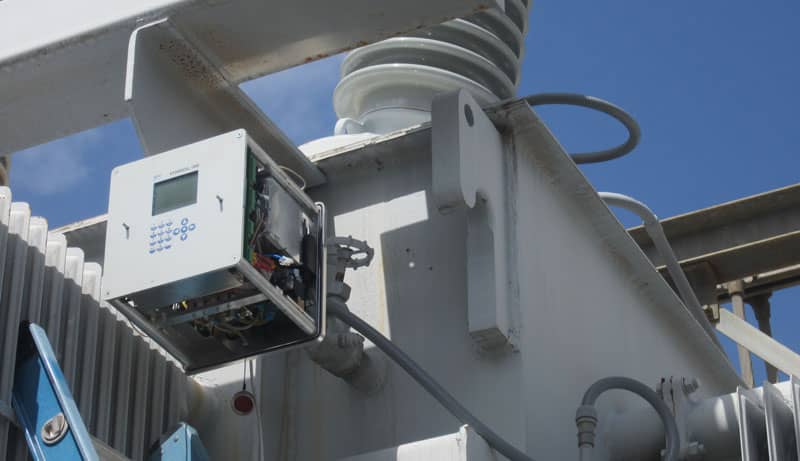
Online solar utility DGA monitoring
Continuous gas trend data (H₂, C₂H₂, CO, moisture) integrated with bushing and PD measurements detect thermal and electrical degradation between annual sample intervals.
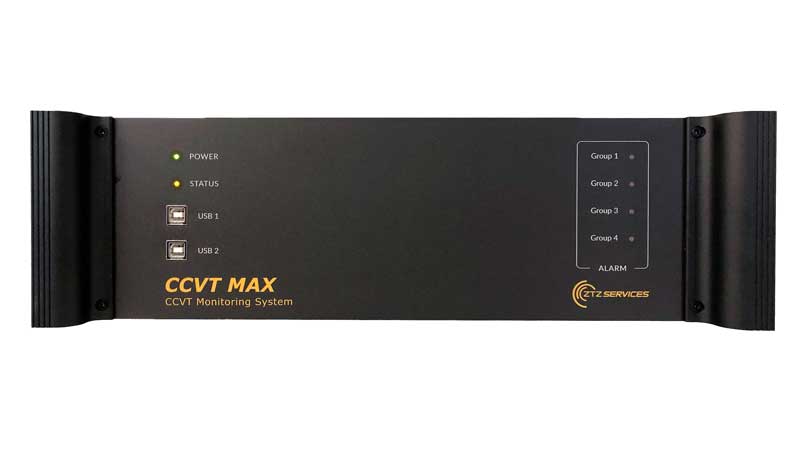
CCVT Monitoring
CCVT MAX identifies loose connections, capacitor degradation, and ferro-resonance before they escalate into bus faults or relay trips that take entire plants offline.
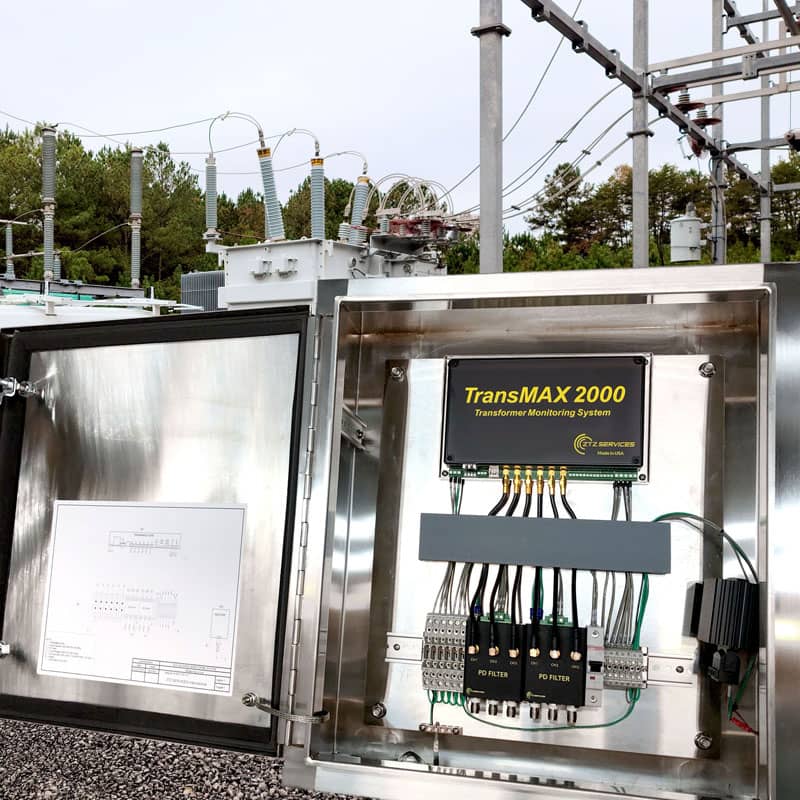
Partial-discharge detection
TRANSMAX 2000 combines PD and power-factor sensing in a single FM-certified sensor, supplying the continuous record required for IEC 60076-14:2025 compliance documentation. SCADA compatible.
Documented detections have flagged defects within days of installation and issued actionable alarms months before catastrophic failure.
Real results backed by field and financial models
Extended transformer life
Life extensions of 2–7 years consistently delivers IRRs exceeding 200 % with payback inside the first year.
| Scenario | IRR | Payback |
|---|---|---|
| 2-year life extension | >200 % | Year 1 |
| 7-year life extension | >200 % | Year 1 |
| Avoided major outage | Additive | Immediate |
Revenue protection
With active monitoring, solar operators protect generation revenue ($10k–$50k per day for a 100 MW facility at typical PPA rates), eliminate emergency-response premiums, and safeguard contracts.
In a recent case study, an operator replaced a failing bushing during a nighttime outage, avoiding operating revenue loss equal to ten times the transformer itself.
Calculate your fleet risk
Profile data does not leave your browser.
Your Personalized Risk & ROI Estimate
Compliance Gap Indicators
Talk to a ZTZ Services engineer about your exact results and the right monitoring solution for your fleet.
Methodology note: Failure probability is estimated using a Weibull distribution (shape β=7.05, characteristic life ε=64.6 years) calibrated to SCE B-Bank fleet data and CIGRE/EPRI composite models (CIGRE TB 642, 2015; EPRI IDB, 2010). NPV calculations assume a 10% weighted average cost of capital, 2.19% annual inflation, and 95% monitoring detection effectiveness. Life extension scenarios are based on the SCE B-Bank financial model (Skog, MTEC, April 2026). Revenue-at-risk estimates use ISO-specific average solar PPA rates. Results are illustrative estimates for planning purposes only and should be validated against your specific asset conditions. No statistics have been fabricated — all model parameters are sourced from published industry studies.
Continuous monitoring supplies solar utilities the evidence needed for:
- Condition-based capital planning and safe deferral of $1–3 million replacements.
- Demonstrable compliance with NFPA 70B, IEC 60076-14:2025, NERC CIP transformer monitoring expectations, and IEEE guidance.
- Fleet-level risk ranking that prioritizes engineering attention where it is actually required.
Ready to supercharge your predictive maintenance?
Active monitoring does not eliminate every risk. It does, however, give solar operators the continuous intelligence required to manage the risks that inverter-based generation, long lead times, and tightening compliance have made unavoidable.
The data is available. The financial case is documented. The next step is yours.