
Introduction
High-voltage bushings are among the most critical and failure-prone components of power transformers. In utility-scale solar generation facilities, transformers operate under harsh environmental conditions and cyclic loading profiles, intensifying thermal and electrical stresses.
This technical article analyzes a real-world case study involving a 34.5/230kV step-up transformer located at a solar generation plant in a desert region of California, USA. Manufactured in 2017, the transformer was equipped with Oil-Impregnated Paper (OIP) bushings on both the high-voltage (HV) and low-voltage (LV) sides. To mitigate the risk of catastrophic asset loss, a continuous online bushing monitoring system was retrofitted in 2023.
Monitoring Methodology
The online monitoring system utilized a combination of three analytical methods to continuously evaluate the dielectric health of the bushings:
- Sum of Three Currents Method (Imbalance) measures the vector sum of the currents passing through the bushing voltage or test taps. Under normal operating conditions, the sum yields a stable baseline; insulation degradation manifests as a shift or trend in the current imbalance.
- Reference Method serves as the primary mechanism for calculating the absolute Power Factor (Tangent Delta). This method correlates bushing test tap signal against a reference voltage source from on-site voltage instrument transformer connected to the same bus as bushing to accurately quantify dielectric losses.
- Adjacent-Phase Method employed as a secondary, relative method to cross-verify the calculated Power Factor (Tangent Delta) by comparing neighboring phases against each other.
Timeline of Insulation Degradation and Failure
The degradation process occurred progressively over several months, shifting from early-stage anomalous behavior to severe dielectric failure.
Phase I: Initial Anomalies (June 2024)
In June 2024, the monitoring system detected the initial signs of an elevation trend in the High-Voltage side bushing current imbalance. Simultaneously, an elevated Power Factor trend was observed on bushing H3 (Phase C). The remaining phases, H1 (Phase A) and H2 (Phase B), stayed entirely within normal operational boundaries.
Phase II: Accelerated Degradation (January – February 2025)
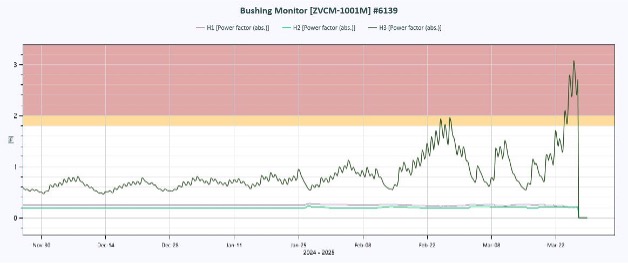
Beginning in January 2025, the dielectric dissipation of the H3 bushing accelerated sharply. By February 2025, the absolute Power Factor had surged past its nameplate value by more than three times, breaching the pre-configured system alarm threshold. Despite formal notifications and automated system alerts, the plant operator elected to maintain the transformer in continuous operation.
Phase III: Critical State and Terminal Failure (March 2025)
By late March 2025, the condition of the H3 bushing had deteriorated critically, with the monitored Power Factor scaling past 2.5%. On March 28, 2025, the progressive insulation breakdown culminated in a terminal bushing failure.
Trend Analysis and Sensor Data
The historical data plots captured by the bushing monitor highlight the predictive capabilities of continuous data logging prior to the system’s terminal fault.
Current Imbalance Trend
The system tracked a corresponding rise in relative current imbalance, confirming that the dielectric shift was not a transient or an artifact of external grid disturbances, but a structural degradation within the H3 bushing insulation. Refer to Figure 3.
Absolute Power Factor Trend
The Power Factor profile shows a distinct divergence between the healthy phases (H1 and H2) and the compromised phase (H3).
Capacitance C1 Trend
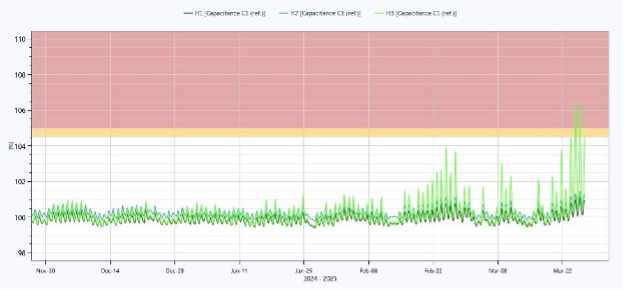
The monitoring system’s capacitance trends revealed that the C1 capacitance of the compromised H3 bushing was significantly more impacted by daily ambient temperature fluctuations than the other two healthy bushings (H1 and H2). While the healthy phases maintained a 1% deviation range. Phase H3 exhibited wide, cyclic capacitance swings tracking the desert’s diurnal temperature curve. This diagnostic behavior fully corresponds with CIGRE TB 755 – Transformer Bushing Reliability (Capacitance Change Ranking C/C20 with temperature changes).
Technical Takeaways
- Early Detection Window: The online monitoring system successfully identified early signs of thermal and electrical deterioration nine months prior to failure and issued an actionable alarm a full month before terminal breakdown occurred.
- Actionable Predictive Maintenance: Bushing power factors that exceed nameplate ratings threefold represent severe partial discharge or moisture/thermal runaway mechanisms. When an alarm threshold is triggered, the asset must be isolated, tested offline, and scheduled for replacement to mitigate the risk of catastrophic transformer explosion.
- Data Validation: Combining current imbalance monitoring with primary absolute reference tracking provides the redundancy needed to validate sensor findings before making critical operational decisions.
Authors: Vasily Topko, Daniel Berler, ZTZ Services International, North Miami USA
